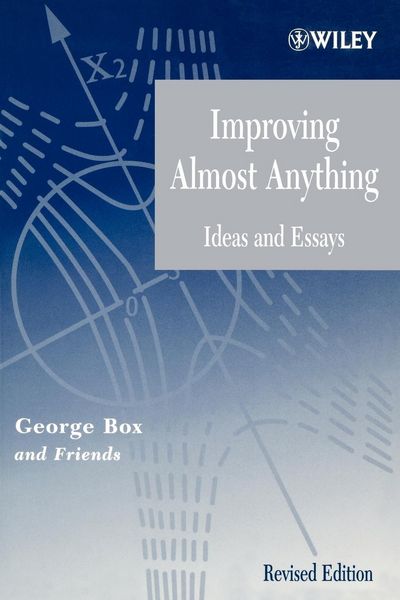
Improving Almost Anything Rev Ed Ideas and Essays
-
- Englisch ausgewählt
125,99 €
inkl. gesetzl. MwSt.,
Beschreibung
Produktdetails
Einband
Taschenbuch
Erscheinungsdatum
01.04.2006
Herausgeber
George E. P. BoxVerlag
John Wiley & Sons IncSeitenzahl
632
Maße (L/B/H)
23,4/15,6/3,4 cm
Gewicht
939 g
Auflage
1. Auflage
Sprache
Englisch
ISBN
978-0-471-72755-2
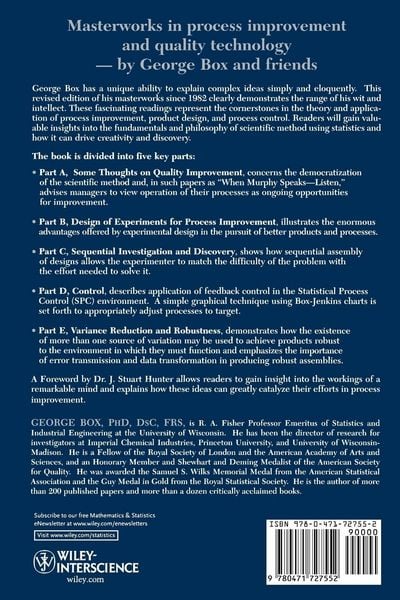
George Box has a unique ability to explain complex ideas simply and eloquently. This revised edition of his masterworks since 1982 clearly demonstrates the range of his wit and intellect. These fascinating readings represent the cornerstones in the theory and application of process improvement, product design, and process control. Readers will gain valuable insights into the fundamentals and philosophy of scientific method using statistics and how it can drive creativity and discovery.
The book is divided into five key parts:
* Part A, Some Thoughts on Quality Improvement, concerns the democratization of the scientific method and, in such papers as "When Murphy Speaks--Listen," advises managers to view operation of their processes as ongoing opportunities for improvement.
* Part B, Design of Experiments for Process Improvement, illustrates the enormous advantages offered by experimental design in the pursuit of better products and processes.
* Part C, Sequential Investigation and Discovery, shows how sequential assembly of designs allows the experimenter to match the difficulty of the problem with the effort needed to solve it.
* Part D, Control, describes application of feedback control in the Statistical Process Control (SPC) environment. A simple graphical technique using Box-Jenkins charts is set forth to appropriately adjust processes to target.
* Part E, Variance Reduction and Robustness, demonstrates how the existence of more than one source of variation may be used to achieve products robust to the environment in which they must function and emphasizes the importance of error transmission and data transformation in producing robust assemblies.
A Foreword by Dr. J. Stuart Hunter allows readers to gain insight into the workings of a remarkable mind and explains how these ideas can greatly catalyze their efforts in process improvement.
Noch keine Bewertungen vorhanden
Verfassen Sie die erste Bewertung zu diesem Artikel
Helfen Sie anderen Kundinnen und Kunden durch Ihre Meinung.
Kurze Frage zu unserer Seite
Vielen Dank für Ihr Feedback
Wir nutzen Ihr Feedback, um unsere Produktseiten zu verbessern. Bitte haben Sie Verständnis, dass wir Ihnen keine Rückmeldung geben können. Falls Sie Kontakt mit uns aufnehmen möchten, können Sie sich aber gerne an unseren Kund*innenservice wenden.
zum Kundenservice