Introduction to Statistical Process Control
137,99 €
inkl. gesetzl. MwSt.,
Beschreibung
Produktdetails
Einband
Gebundene Ausgabe
Erscheinungsdatum
16.09.2020
Verlag
John Wiley & SonsSeitenzahl
304
Maße (L/B/H)
23,6/16,1/2,1 cm
Gewicht
531 g
Auflage
1. Auflage
Sprache
Englisch
ISBN
978-1-119-52845-6
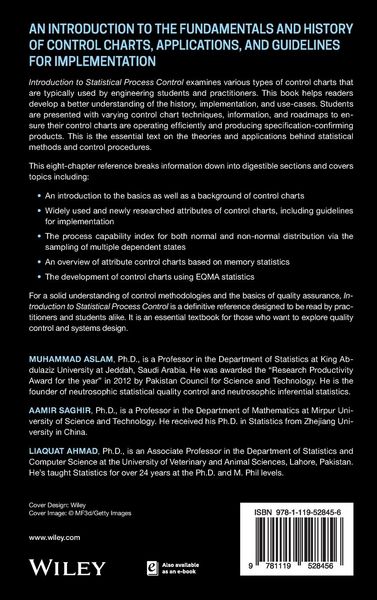
An Introduction to the Fundamentals and History of Control Charts, Applications, and Guidelines for Implementation
Introduction to Statistical Process Control examines various types of control charts that are typically used by engineering students and practitioners. This book helps readers develop a better understanding of the history, implementation, and use-cases. Students are presented with varying control chart techniques, information, and roadmaps to ensure their control charts are operating efficiently and producing specification-confirming products. This is the essential text on the theories and applications behind statistical methods and control procedures.
This eight-chapter reference breaks information down into digestible sections and covers topics including:
* An introduction to the basics as well as a background of control charts
* Widely used and newly researched attributes of control charts, including guidelines for implementation
* The process capability index for both normal and non-normal distribution via the sampling of multiple dependent states
* An overview of attribute control charts based on memory statistics
* The development of control charts using EQMA statistics
For a solid understanding of control methodologies and the basics of quality assurance, Introduction to Statistical Process Control is a definitive reference designed to be read by practitioners and students alike. It is an essential textbook for those who want to explore quality control and systems design.
Kundinnen und Kunden meinen
Verfassen Sie die erste Bewertung zu diesem Artikel
Helfen Sie anderen Kund*innen durch Ihre Meinung
Kurze Frage zu unserer Seite
Vielen Dank für Ihr Feedback
Wir nutzen Ihr Feedback, um unsere Produktseiten zu verbessern. Bitte haben Sie Verständnis, dass wir Ihnen keine Rückmeldung geben können. Falls Sie Kontakt mit uns aufnehmen möchten, können Sie sich aber gerne an unseren Kund*innenservice wenden.
zum Kundenservice