Beschreibung
Produktdetails
Einband
Taschenbuch
Erscheinungsdatum
27.01.2020
Verlag
Sage PublicationsSeitenzahl
536
Maße (L/B/H)
23,5/19,1/2,9 cm
Gewicht
890 g
Auflage
4. überarbeitete Auflage
Sprache
Englisch
ISBN
978-1-5063-6843-6
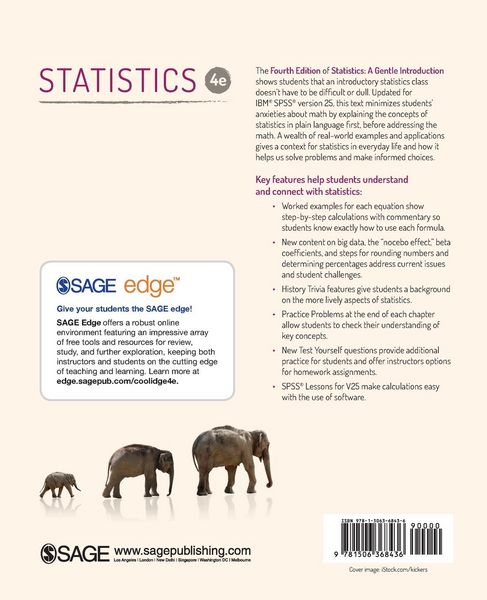
The Fourth Edition of Statistics: A Gentle Introduction shows students that an introductory statistics class doesn’t need to be difficult or dull. Author Fred Coolidge minimizes students’ anxieties about math by explaining the concepts of statistics in plain language first, before addressing the math. Each formula within the text has a step-by-step example to demonstrate the calculation so students can follow along. Only those formulas that are important for final calculations are included in the text so students can focus on the concepts, not the numbers. A wealth of real-world examples and applications gives a context for statistics in the real world and how it helps us solve problems and make informed choices. New to the Fourth Edition are sections on working with big data, new coverage of alternative non-parametric tests, beta coefficients, and the "nocebo effect," discussions of p values in the context of research, an expanded discussion of confidence intervals, and more exercises and homework options under the new feature "Test Yourself."
Kundinnen und Kunden meinen
Verfassen Sie die erste Bewertung zu diesem Artikel
Helfen Sie anderen Kund*innen durch Ihre Meinung
Kurze Frage zu unserer Seite
Vielen Dank für Ihr Feedback
Wir nutzen Ihr Feedback, um unsere Produktseiten zu verbessern. Bitte haben Sie Verständnis, dass wir Ihnen keine Rückmeldung geben können. Falls Sie Kontakt mit uns aufnehmen möchten, können Sie sich aber gerne an unseren Kund*innenservice wenden.
zum Kundenservice